When a production backend fails, the hard part is not producing an ERROR log. The hard part is answering four questions quickly:
- Did a real customer request fail?
- Is the failure happening often enough to need attention?
- What exactly failed: the API, the database, a background worker, or an AI provider?
- Can the person receiving the alert investigate without manually searching through thousands of log lines?
I recently built a production alerting pipeline for our ECS backend on AWS. It starts with structured logs and ends with a useful Discord notification:
ECS backend
  → CloudWatch Logs
  → metric filter
  → CloudWatch alarm
  → SNS topic
  → Lambda formatter
  → Discord
This post is about the implementation decisions that made the pipeline useful in production—not just the architecture diagram.
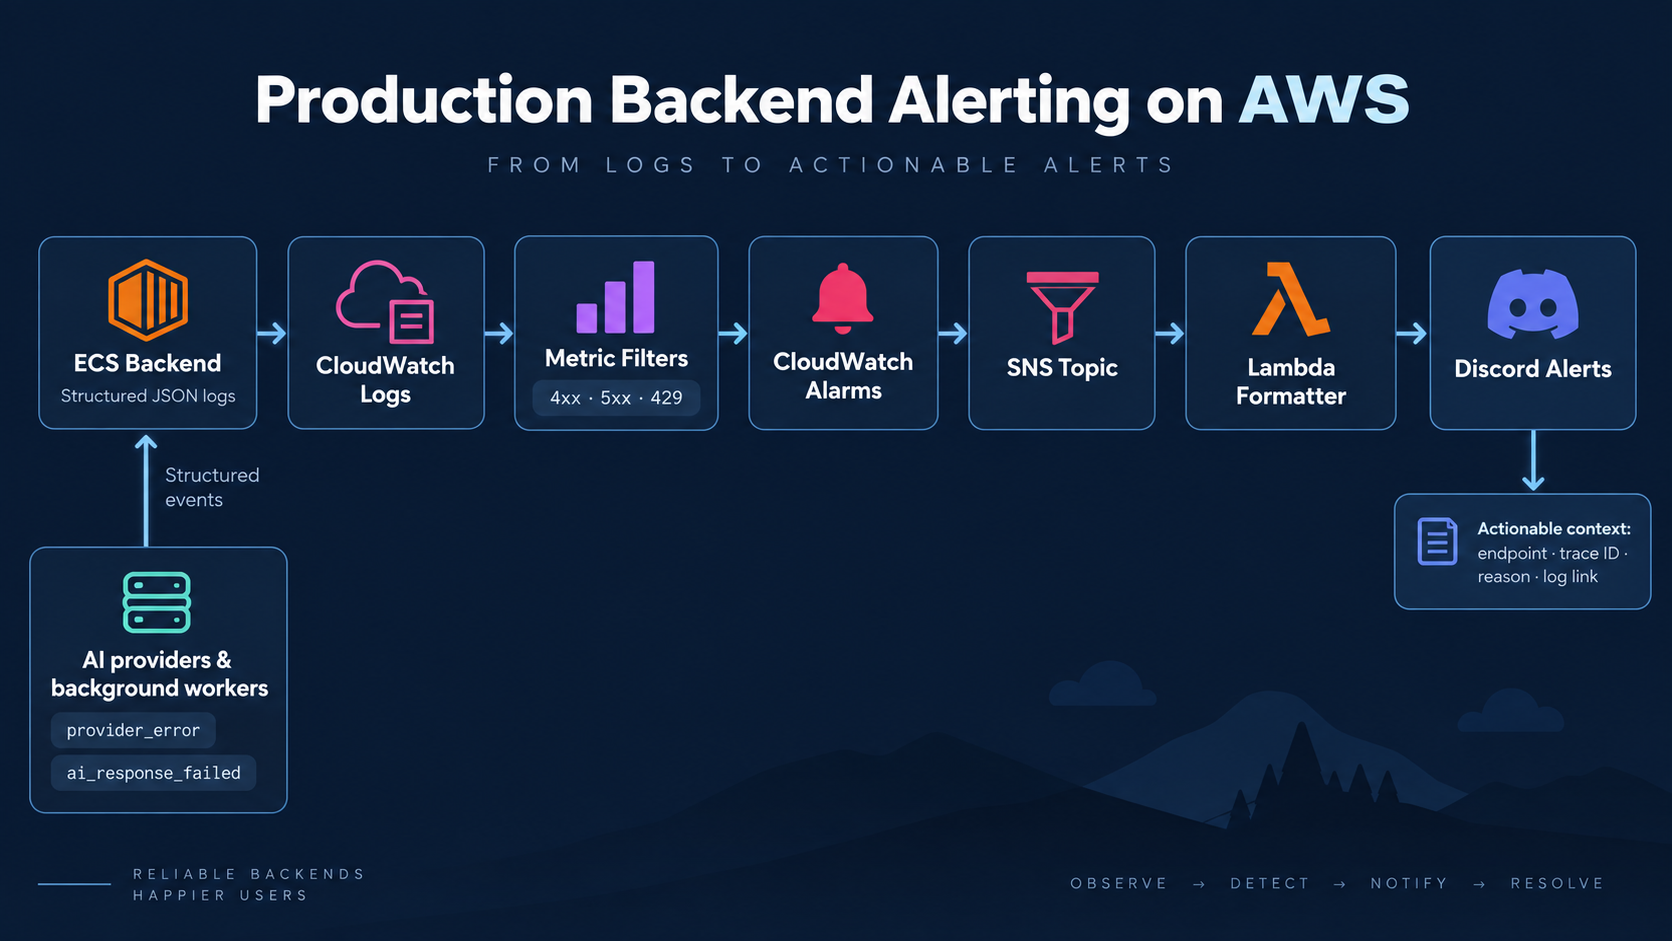
The production alerting path from an ECS log event to an actionable Discord notification.
The starting point: logs existed, but alerts did not
Our Python backend already used Loguru. The same development-oriented logger was also used in production. That gave us logs in CloudWatch, but it did not give us operational signals.
Plain-text logs are difficult to turn into dependable alarms. For example, a metric filter should not need to guess whether a sentence contains an error code. I changed the production logger to emit structured JSON and made every completed HTTP request write a consistent event:
{
  "event": "request_finished",
  "method": "POST",
  "path": "/api/v1/example",
  "status_code": 500,
  "outcome": "error",
  "trace_id": "6aa186b6dd8ae2ca6f8d6b4747a2bd12",
  "span_id": "d6881111238a72c6"
}
That contract is the foundation of the alerting system. CloudWatch metric filters can match JSON fields and turn matching log records into countable metrics, which CloudWatch alarms can evaluate (as detailed in the AWS CloudWatch Metric Filters documentation).
The first production alarms: 4xx, 5xx, and 429
I created separate HTTP signals rather than one giant “error” alarm.
| Alarm | Filter intent | Why it matters |
|---|---|---|
| Backend 4xx | Client-side failures | Detects bursts from invalid requests, crawler traffic, authentication failures, missing resources, and validation errors. |
| Backend 5xx | Server-side failures | Detects failures while the backend is processing a request. |
| Backend 429 | Explicit backend throttling | Separates rate limiting from other client errors. |
The 4xx alarm is deliberately treated differently from 5xx. A 422 validation error can be completely normal; a sudden burst of 404s may be a crawler; and 401/403 can point to an integration issue. The alert is there to reveal an abnormal pattern, not to claim every 4xx is an outage.
The 5xx alarm is the core backend-health alert. I configured it with a lower threshold because one real server failure can be actionable. The 4xx alarm uses a higher threshold because it is naturally noisier.
There is one subtlety worth calling out: if the broad 4xx filter includes 429 and there is also a dedicated 429 filter, the same request contributes to both metrics. That is not automatically wrong. It gives a broad client-error view plus a specific rate-limit view. The important thing is to understand the overlap before interpreting the alert count.
What a CloudWatch metric filter actually does
A metric filter is not a query that runs after an incident. It watches logs as they arrive and publishes a metric value when a pattern matches.
For a 5xx request alarm, the pattern is conceptually:
{ $.event = "request_finished" && $.status_code >= 500 }
Each match publishes a metric value of 1. The alarm watches the metric's Sum over a period such as five minutes.

CloudWatch metric filter configuration showing the 5xx filter pattern and metric transformation.
This distinction matters when configuring the alarm:
- Metric value:
1, because every matching event increments the count. - Statistic:
Sum, because we care about the number of failures. - Threshold: the number of matching events that should trigger attention.
- Missing data treatment: usually treat as good for error-count metrics, so quiet periods do not become incidents.
- Dimensions: avoid them initially unless there is a concrete operational need. Every unique dimension combination creates a separate metric and can increase cost and complexity.
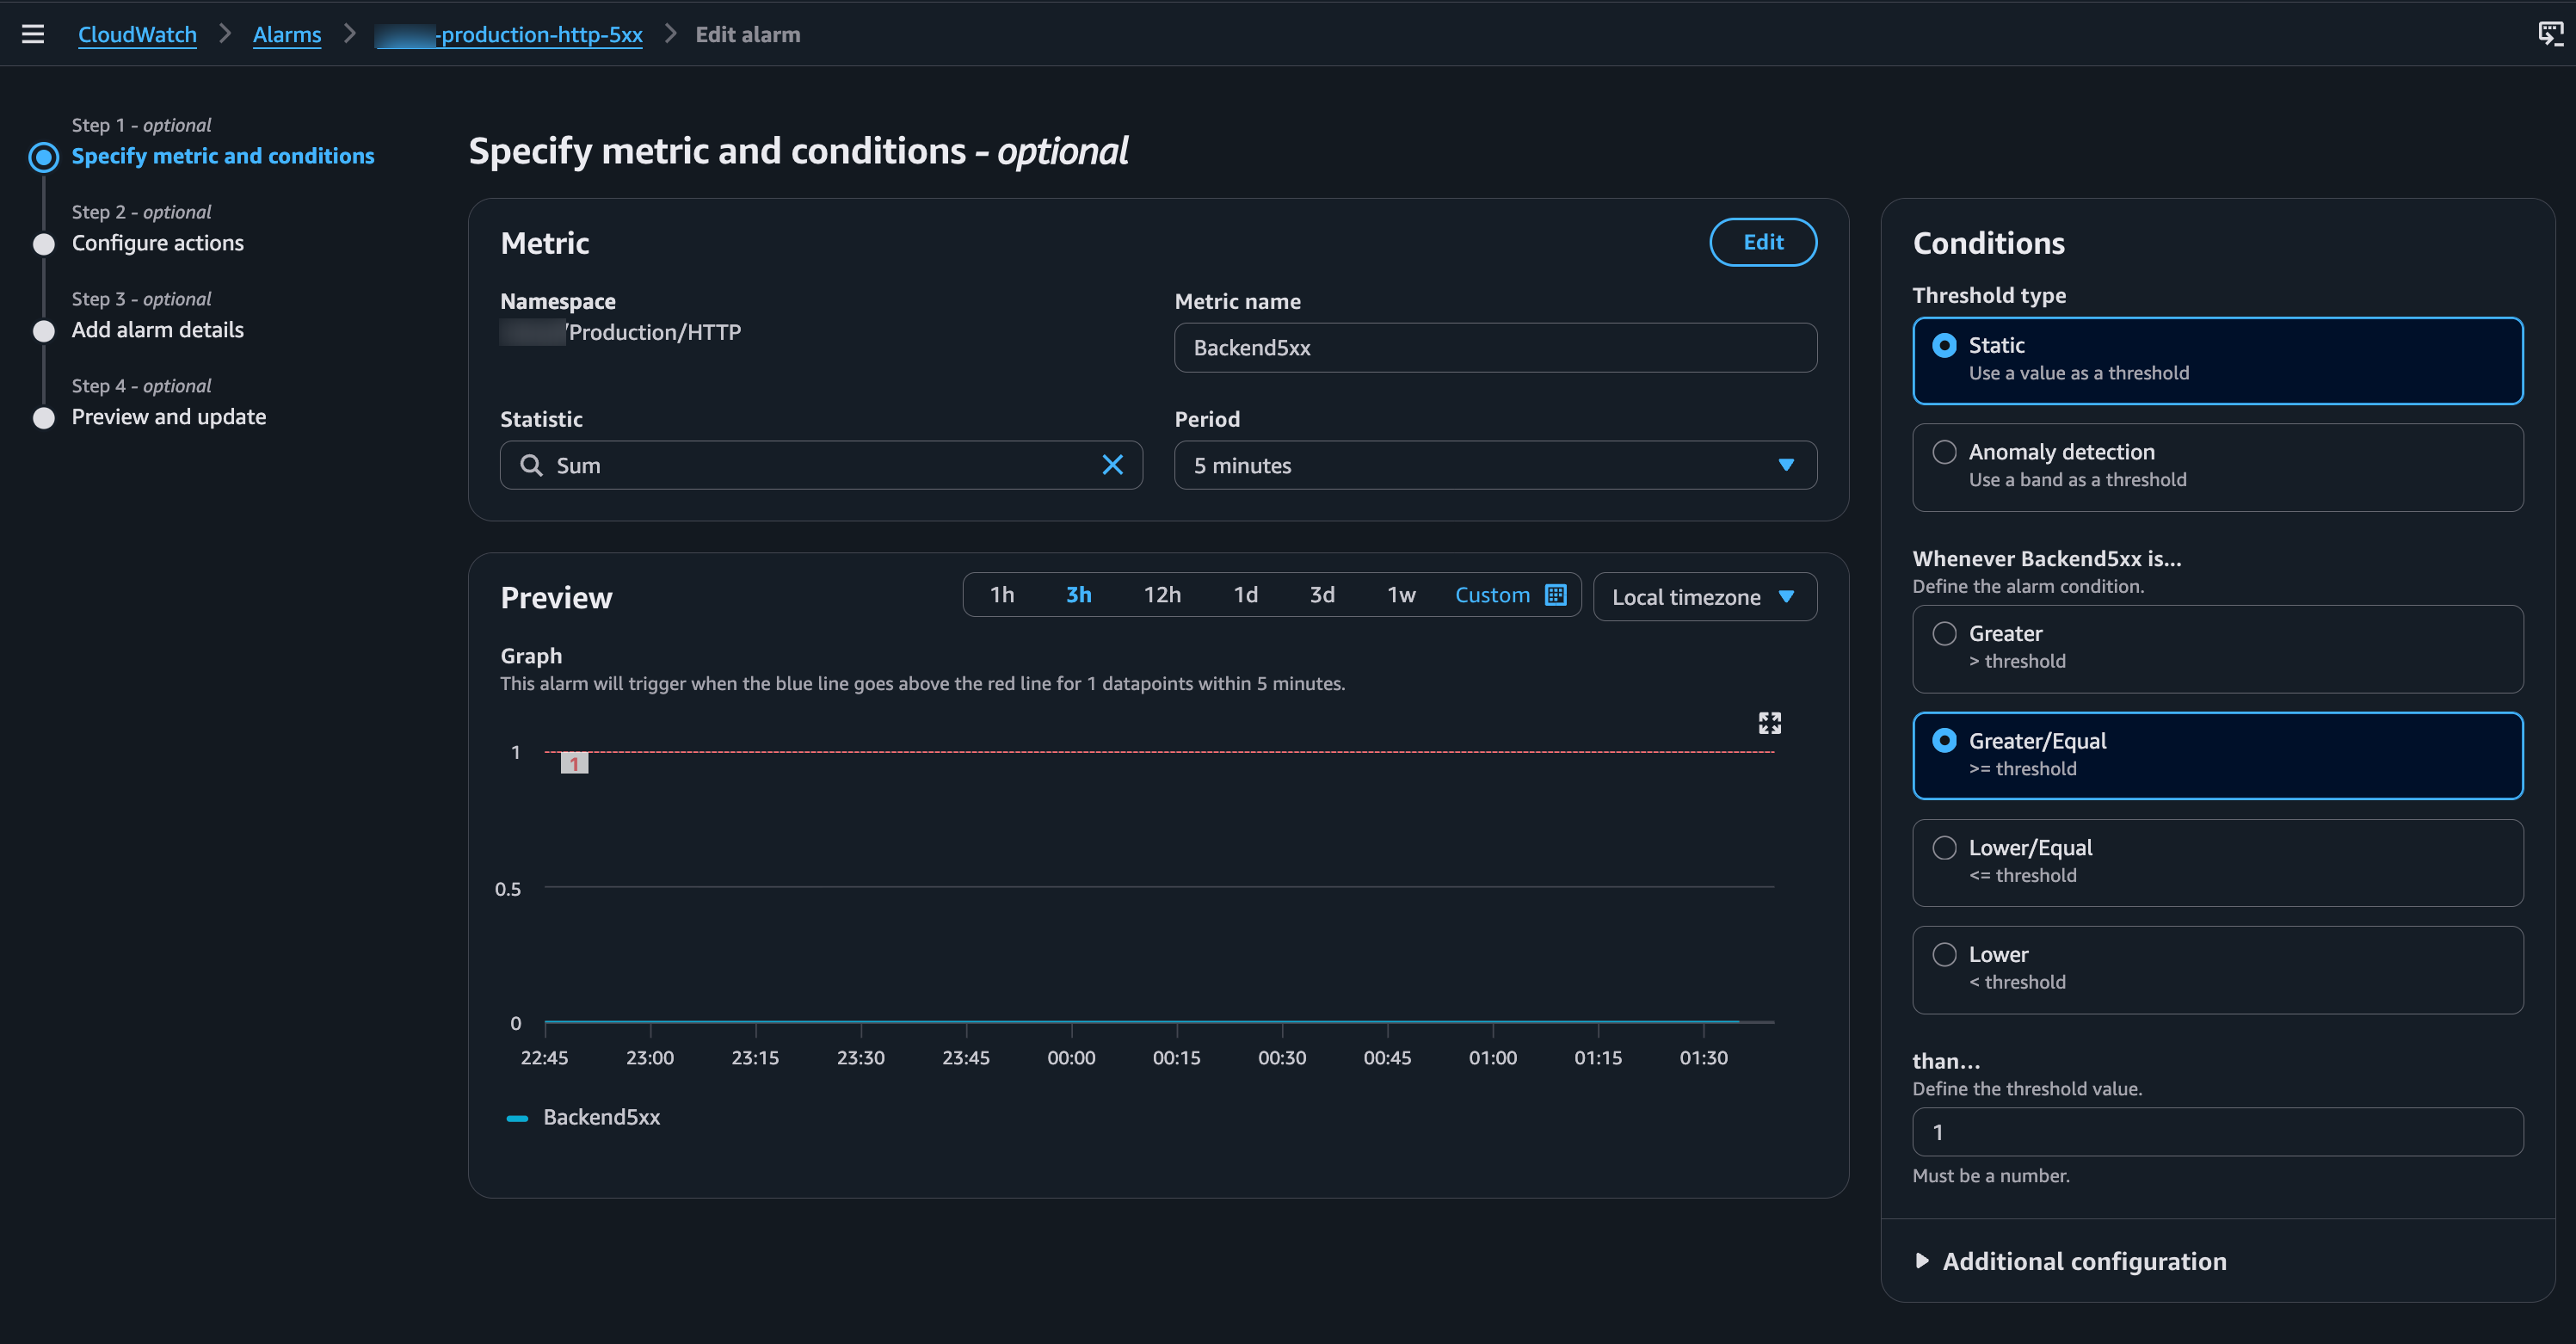
CloudWatch alarm configuration highlighting the 5-minute period and datapoints-to-alarm.
AWS provides a detailed breakdown of threshold, evaluation period, and missing-data configurations in their guide on creating alarms from metric filters.
SNS gets the alarm out; Lambda makes it useful
CloudWatch can publish alarm state changes to Amazon SNS. SNS is reliable for delivery, but the default alarm text is not a great incident message. It tells you that a threshold crossed, not what a customer or engineer needs to know next.
I used an SNS-triggered Lambda as the formatting and enrichment layer.
The Lambda:
- Receives the CloudWatch alarm payload from SNS.
- Identifies the alarm type from its name.
- Queries the backend log group with CloudWatch Logs Insights for recent matching events.
- Creates a Discord embed with the relevant context.
- Posts it through a Discord webhook stored in AWS Secrets Manager.
The result is an alert that includes the alarm name, explanation, threshold details, region, time, log-group link, and—when available—recent endpoint, status code, trace ID, and span ID.
That final step is where the design gets practical. A message saying “5xx alarm is in ALARM” is not enough. A useful message says which endpoint failed and gives the responder a direct route to the logs.
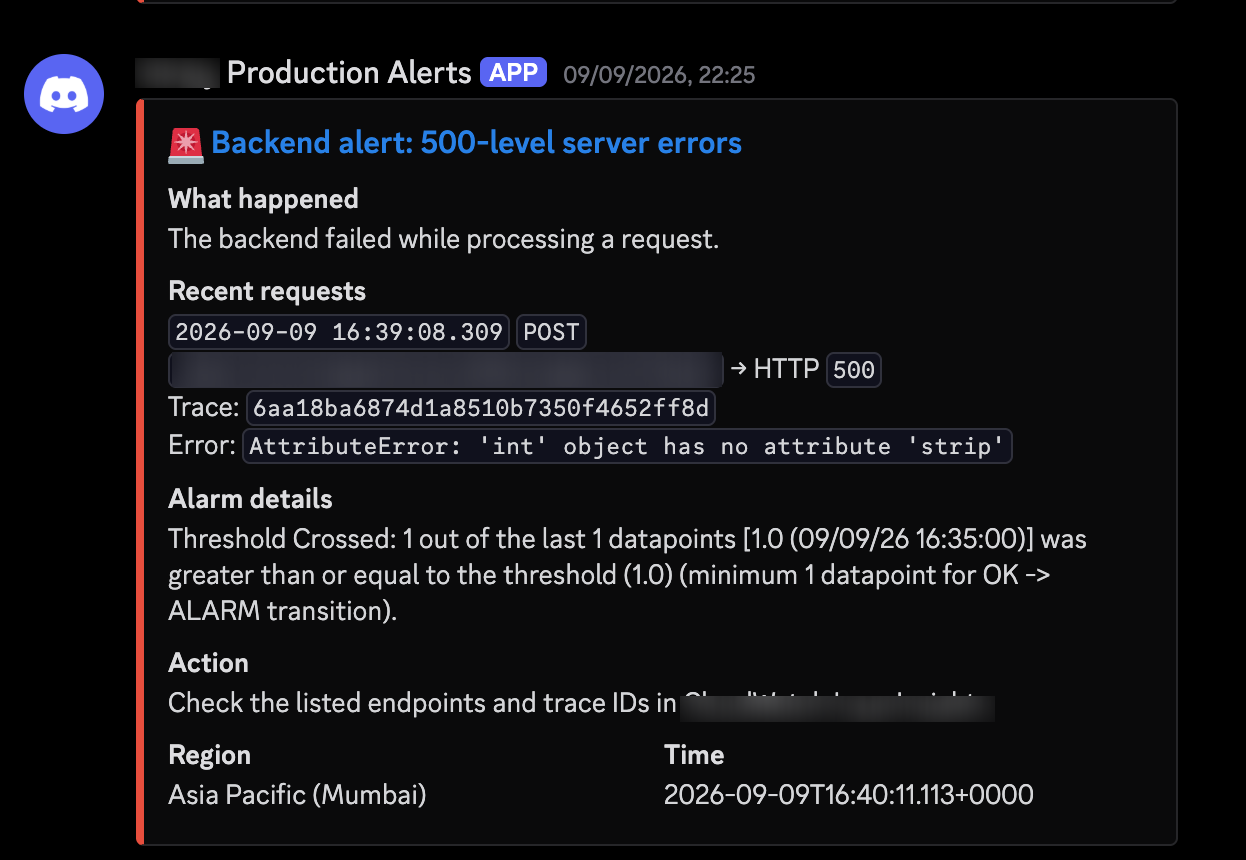
Enriched Discord alert containing the failing endpoint, trace ID, reason, and direct CloudWatch log link.
The first bug: the alert had no request details
One of the first Discord alerts displayed:
No matching request details were available in the last 10 minutes.
The alarm itself was valid. The bug was in the Lambda enrichment query: it knew how to query 429 and 5xx alarms, but it had no condition for a 4xx alarm. It returned an empty list immediately.
The fix was simple but important: map every supported alarm name to its own Logs Insights condition. For 4xx, the Lambda now queries request_finished events where the status is between 400 and 499.
The main takeaway was clear: test the notification enrichment path end-to-end, not just the metric filter trigger. An alarm can fire perfectly in CloudWatch while the resulting notification is still operationally useless to the responder.
The second gap: AI provider failures are not always HTTP 429
Our backend uses AI services in request handling and background work. A provider can fail with quota exhaustion, overload, timeout, authentication failure, or an invalid request. The failure may be surfaced by an SDK as a typed exception, and it may not have a clean HTTP status code at all.
For example, a Vertex/Gemini quota failure may appear as RESOURCE_EXHAUSTED with no numeric status. An HTTP 429 metric filter does not see that unless the backend itself returns a 429 response.
That is why I added a structured provider event:
{
  "event": "provider_error",
  "provider": "vertexai",
  "service": "gemini",
  "component": "support_case_router",
  "operation": "support_case_router",
  "reason": "resource_exhausted",
  "provider_status": null,
  "error_type": "ClientError"
}
The classifier turns provider exceptions into stable reasons:
| Reason | Meaning |
|---|---|
| resource_exhausted | Quota, rate limit, or capacity exhaustion. |
| provider_unavailable | Provider-side 5xx, overload, or temporary unavailability. |
| authentication_failed | Credential or permission failure. |
| timeout | A dependency call exceeded its deadline. |
| invalid_request | The provider rejected the request. |
| unknown | The failure needs investigation before it can be categorized safely. |
The important design choice is that the classifier does not infer an AI provider from any random error message. A Google Cloud Storage URL should not become a Gemini incident just because it contains googleapis.com. Provider identification is based on known SDK origins or explicit context from the calling code.
An HTTP success is not always a customer success
The hardest operational case was asynchronous inbound messaging.
The webhook endpoint receives a WhatsApp, Facebook, or Instagram event, pushes the work to a background path, and responds quickly. That is the right behaviour for webhook delivery—but it introduces a blind spot:
Webhook returns HTTP 200
        ↓
Background AI processing fails
        ↓
Customer receives no response
There may be no HTTP 5xx. There may be no HTTP 429. Yet this is clearly a customer-impacting failure.
To cover that case, I added an outcome event:
{
  "event": "ai_response_failed",
  "platform": "whatsapp",
  "component": "support_agent",
  "reason": "agent_failed",
  "provider": "vertexai",
  "model": "gemini-3.7-flash"
}
It is emitted only when a real customer turn reaches the AI stage and ends without usable reply text. Intentional no-reply cases—such as a paused bot, a disabled bot, or an internal preview—are excluded. That difference keeps the signal meaningful.
The combined AI/customer-impact alert
Instead of creating a Discord alarm for every possible exception, I grouped the AI failures that warrant attention:
provider_error with reason = resource_exhausted
OR
ai_response_failed
This makes the alert answer a business-relevant question:
Is the AI dependency exhausted, or did a real customer message fail to receive a response?
The Lambda formats these events differently from HTTP errors. A provider event shows provider, service, component, reason, status, model, and trace identifiers. An ai_response_failed event shows the customer channel, agent component, provider, and failure reason.
That is more useful than a generic ERROR alarm. A global ERROR filter would include expected handled failures, database warnings, validation noise, and unrelated background problems. It would alert often and teach the team to ignore Discord.
Security and cost decisions I made
Alerting is a data pipeline, so it needs the same care as the application itself.
Do not send provider exception text blindly
SDK exceptions can include request fragments. For provider-error events, I log safe structured metadata—such as provider, error type, reason, status, component, and timing—without attaching the full provider exception traceback. That keeps prompts, generated content, and other sensitive request data out of Discord notifications.
Store the webhook outside source code
The Discord webhook is stored in AWS Secrets Manager. The Lambda receives only the secret identifier as an environment variable. This avoids placing a live webhook in source code or a Lambda deployment package.
Control metric cardinality
It is tempting to add dimensions for every endpoint, tenant, model, or error message. That creates many separate CloudWatch metrics and makes alarms harder to reason about. I started with aggregate metrics and kept detail in logs. I can add dimensions later when a specific operational question requires them.
Query only a short window for notification context
The Lambda uses a short Logs Insights window to enrich an alarm with recent examples. The alarm itself comes from the metric filter; the query only adds investigation context. This keeps the Discord message compact and limits unnecessary query scanning.
What I would do next
This is not the end of observability work. The next improvements I would make are:
- Add the same structured dependency boundary to PostgreSQL, Redis, S3, and outbound Meta delivery calls.
- Add a
message_delivery_failedevent for cases where AI generates a reply but the platform send fails. - Tune thresholds using real traffic rather than guesses made on day one.
- Build a small dashboard for error rates, provider failure reasons, and customer-impacting no-response events.
- Review retention and Logs Insights usage after enough production traffic has accumulated.
A dependable alerting pipeline is not about broadcasting every single warning—it is about preventing alert fatigue. When a notification lands in Discord, the on-call engineer should immediately have the exact context, failing endpoint, and log link required to start diagnosing the problem without second-guessing the alert.